What report shows a visual representation of user interactions on a website?
In the dynamic world of online business and digital marketing, understanding how users interact with your website is paramount. It’s the key to optimizing user experience, improving conversions, and enhancing overall website performance.
The Importance of Understanding User Interactions
When visitors land on your website, their interactions—clicks, scrolls, and navigations—provide valuable insights into their behavior and preferences. This information helps you tailor your website to meet their needs, ultimately driving higher engagement and conversions.
Tools and Technologies for Tracking User Interactions
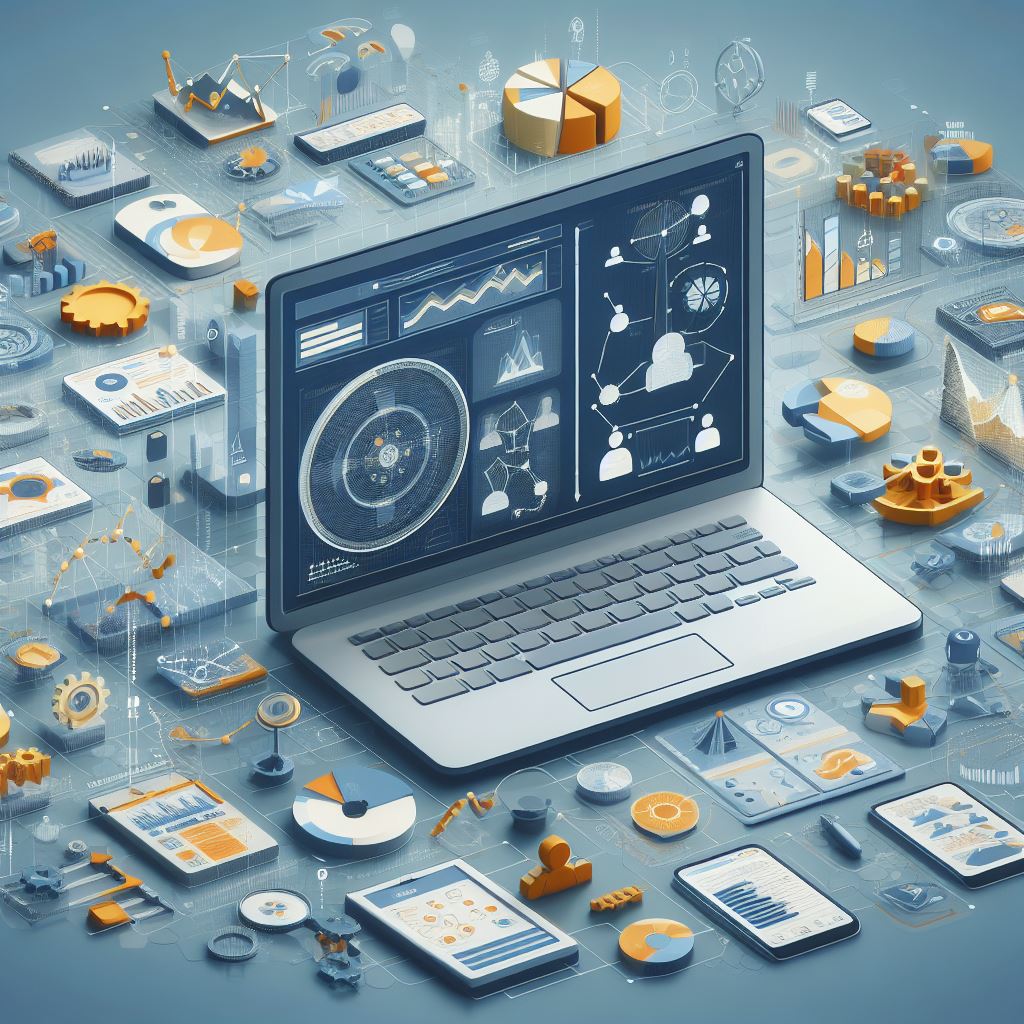
In the digital realm, various tools and technologies are available to track and analyze user interactions. These range from sophisticated analytics platforms to specialized tools like heatmaps, click maps, and session replays.
Key Metrics in User Interaction Tracking
Understanding key metrics, such as click-through rates, bounce rates, time on page, and conversion rates, allows businesses to gauge the effectiveness of their website and make data-driven improvements.
Heatmaps: Visualizing User Interactions
Heatmaps are powerful visual tools that provide a clear representation of where users are clicking, how far they scroll, and which areas of the website receive the most attention. They offer valuable insights into user behavior and can be instrumental in optimizing web page layouts.
Click Maps: A Detailed Look at Clicks
Click maps take the analysis a step further by showing exactly where users click on a webpage. This data is invaluable in optimizing calls-to-action, buttons, and other interactive elements.
Scroll Maps: Understanding Scrolling Behavior
Scroll maps indicate how far users scroll down a page before losing interest. This information helps optimize content placement and length for maximum engagement.
User Session Replays: Watching Interactions in Real-Time
User session replays allow you to watch recordings of individual user sessions in real time, providing an in-depth understanding of their interactions and potential pain points.
Behavior Flow Charts: Mapping User Journeys
Behavior flow charts visualize the paths users take through your website. Analyzing these flow charts helps identify popular routes and areas where users often drop off.
Benefits of Visual Representation in User Interaction Tracking
Visualizing user interactions offers a compelling and easily digestible way to understand user behavior, enabling informed decision-making and targeted website enhancements.
Improving User Experience through Insights
By leveraging insights derived from visual representation and user interaction data, businesses can enhance user experience, leading to improved satisfaction and increased customer loyalty.
How to Utilize User Interaction Data Effectively
To make the most of user interaction data, it’s essential to analyze it comprehensively and implement strategic changes that align with user preferences and behaviors.
Challenges and Considerations in User Interaction Tracking
While user interaction tracking provides invaluable insights, it’s important to address challenges like data privacy and accuracy to ensure ethical and accurate data analysis.
Future Trends in User Interaction Tracking
Advancements in AI and machine learning are set to revolutionize user interaction tracking, offering deeper insights and more sophisticated analytical capabilities.
Empowering UX through Visual Insights
Understanding and visualizing user interactions on a website is crucial for optimizing user experience and achieving business goals. Utilizing advanced tracking tools and technologies empowers businesses to make data-driven decisions, ultimately leading to a more engaging and effective online presence.